Snap to it
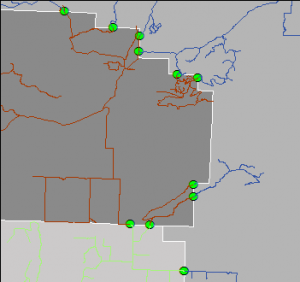
One of the challenges of integrating data across boundaries is edge matching, or in this case, line matching. Our data sharing group took the first step toward solving a seamless roads dataset by agreeing on “snap points”, where each agency would snap their roads at the boundary line with the next. Theoretically, if two people snapped the lines in their individual datasets to the same point, the data would be lined up and ready for integration. In the image, the bright green points are the snap points. At this scale, everything looks nice and happy.


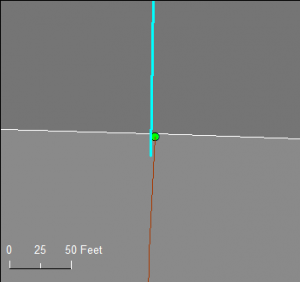
Zooming in, problems emerge. How to address this without manually examining every point in an eight-county area of over 8500 square miles? We know that looks are deceiving at large scales in ArcMap: on screen the line(s) might appear snapped when not, and vice versa.
Goal
The goal was provide an automated tool to check each snap point to make sure the nearby line endpoints are coincident. Hopefully, this tool can be run once by the person integrating the data. If problems are found, the source agency can be notified and encouraged to fix their data. Once fixed, the data should (again in theory) stay fixed.
I tried many things
Topology? I don’t know how to set up a topology rule which states that every point must be covered by at least two endpoints (not just one).
Intersect? This had promise – every point should be intersected by two lines. But wait, what if a line goes through instead of snapping at the endpoint? Errors I could see on the screen continued to be missed, causing me to mistrust the results. After many, many iterations of Select by Location, I cast my net a little further. I found disjoint.
